Use a Threat Map, Visualize Your Cyber Threats

Identifying which threats need your focus is tough with an increasing number of adversaries and the expanding complexity of organizations' ecosystems. To define your threat landscape, provide direction and prioritize threats, your security team needs an automated and real-time way to assess and visualize your current threat landscape.
What is a threat map?
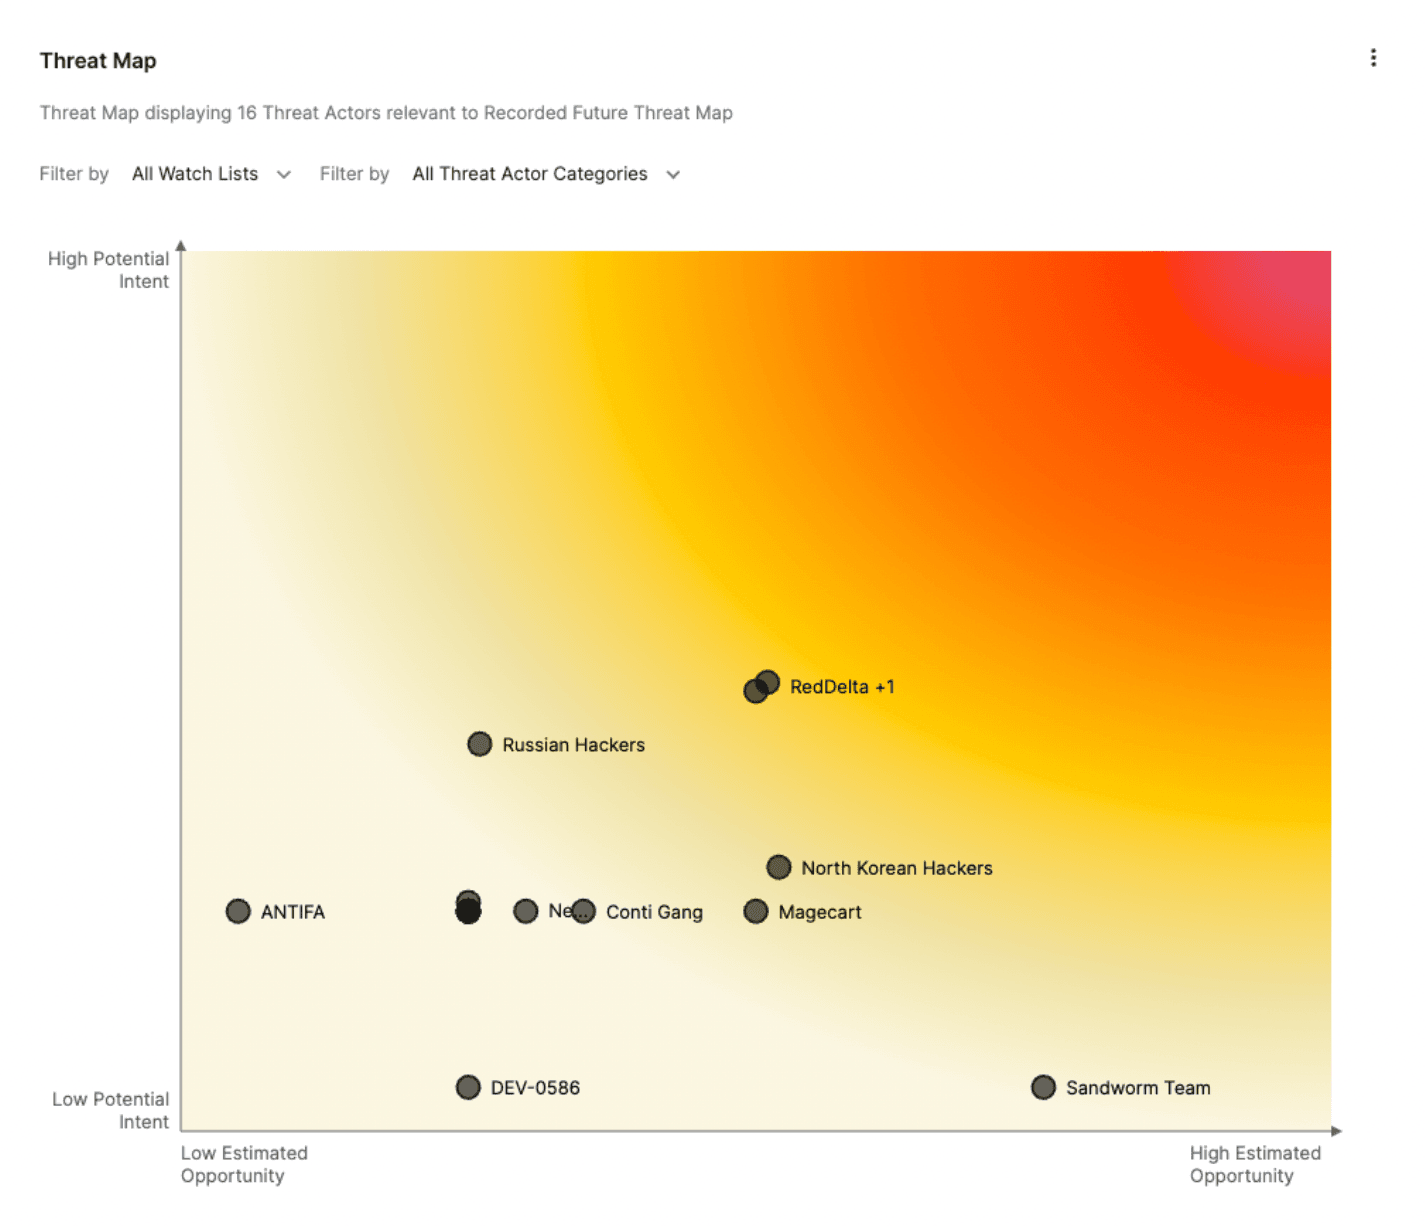
Whether tracking hacktivists, cybercriminals, state-sponsored, or others, our threat map identifies the threat actor groups to focus on. Automating the analysis of their intent and the opportunity they have to harm your organization. The Recorded Future threat map shows your organization's current threat landscape with real-time updates – so you can focus on what matters most to you.

How does Recorded Future build a threat map?
Our threat map generates or updates automatically by analyzing over 1 million unique cyber attack events, with Natural Language Processing analysis from our Intelligence Graph and Insikt Group® research.
From these types of events, we automatically build out threat actor entities and create relationships to indicators of compromise (IOCs), infrastructure, and methods. Our process collects, processes, and then analyzes the information to connect relationships between Tactics, Techniques, and Procedures (TTPs), attack vectors, Common Vulnerabilities and Exposures (CVEs), associated victims, and malicious infrastructure.
With all of the intelligence collected and corroborated, we ensure relevance by running a real-time update of the information presented on the threat map. Old events and evidence age out and are removed, while new events are constantly added to the analysis in real-time.
Making the threat landscape – visual.
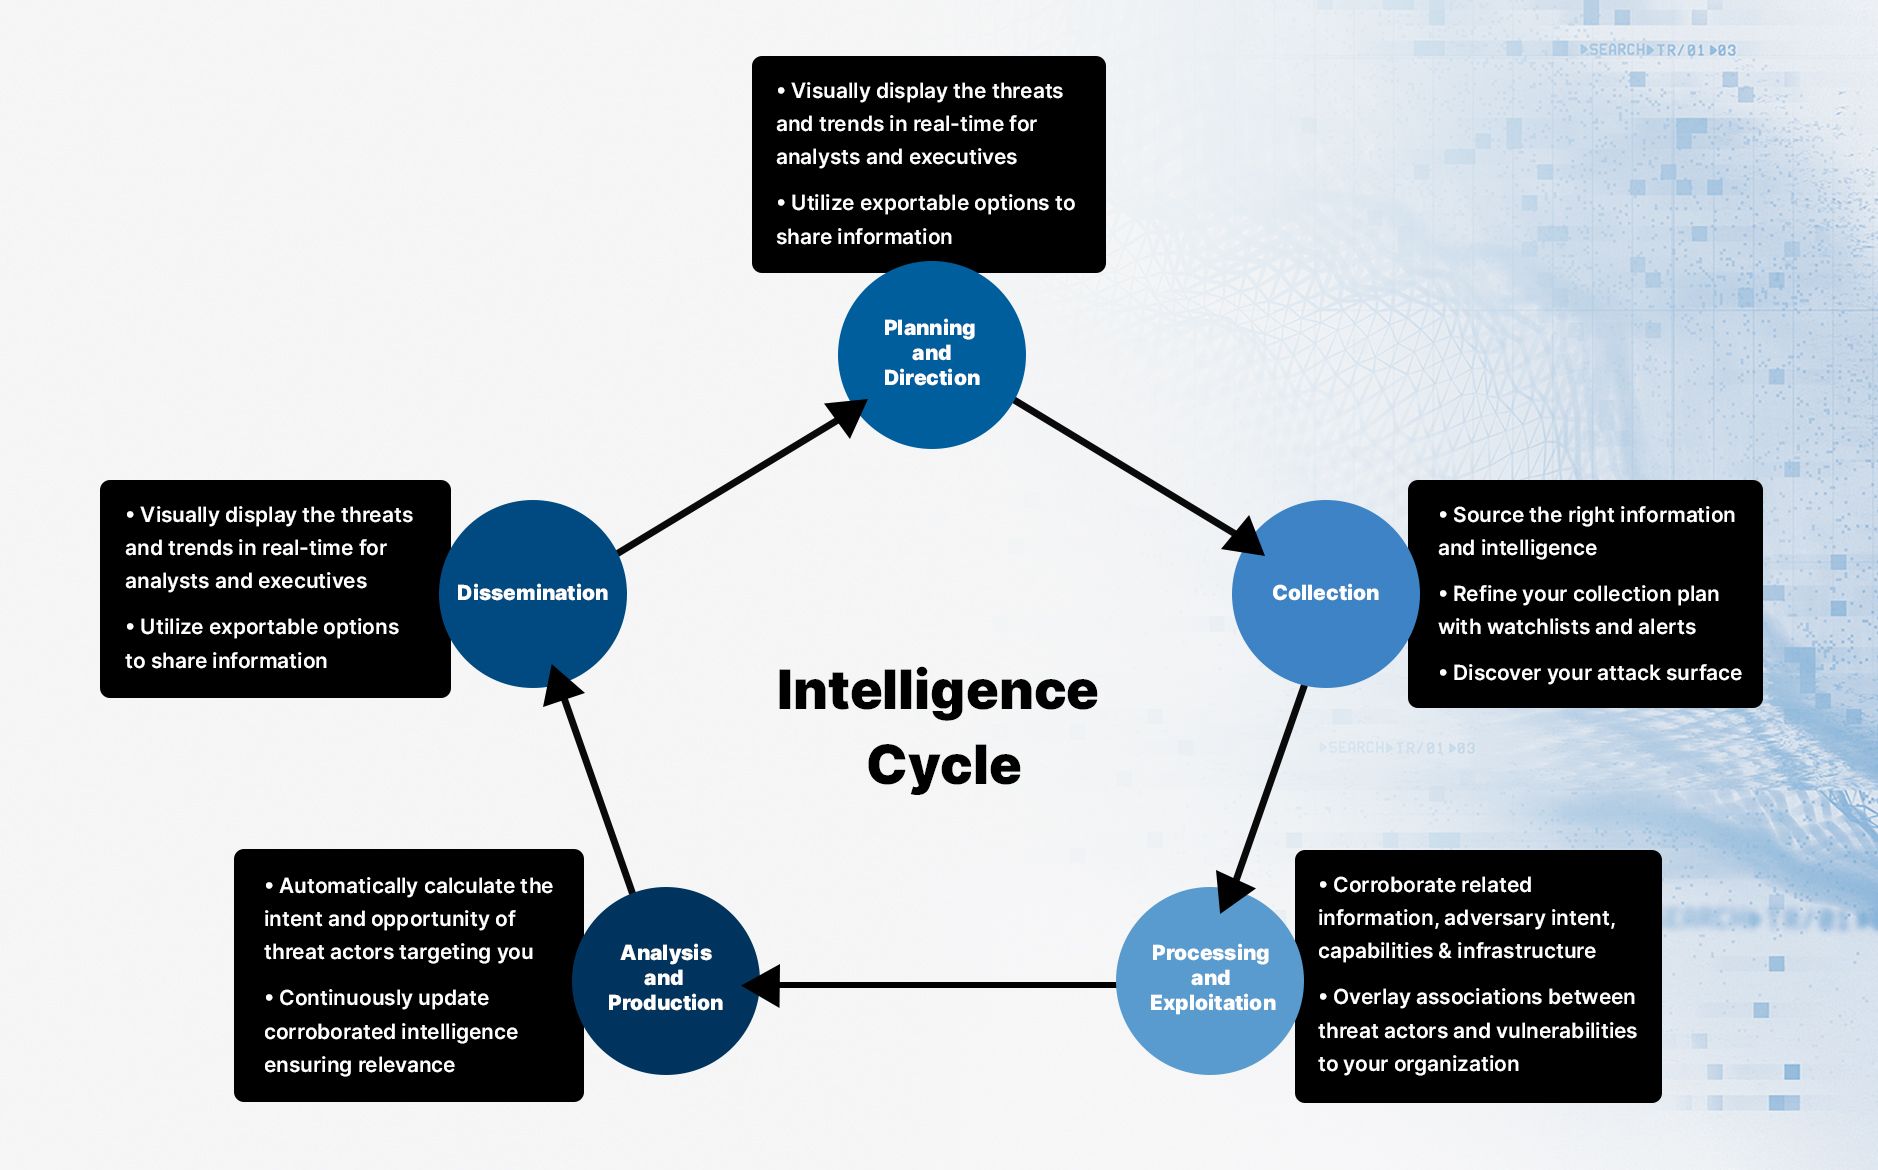
Building a structured and repeatable method of identifying and prioritizing threat actors relevant to your enterprise is a great way to help your organization in defining what matters to you. Building a map of your threat landscape by utilizing the Intelligence Cycle is a great way to make sure your organization remains focused:

There's some coding involved, but no need to pull out your programming book. We graph all of this data automatically and continuously for you, with no need for costly or time-consuming human consulting.
The Y-Axis: Potential Intent
The vertical Y-axis, describes the intent of a threat actor; in other words, it's the victimology, what a threat actor presented previous interest in. This includes industry, peers, third parties, executives, and more.
All of the events that contain information/intelligence about victimology, or types of people, places, or things that are threat actor targets, from our curated Intelligence Graph in addition to our research team, Insikt Group®, are categorized based on the relevant watchlists within our platform. Produced upon initial setup some of the watchlists include Industry Peers, Domains, Brand Names, and Location watchlists which ultimately produce the details needed to determine the intent of a threat actor that are then plotted on the threat map.
The X-Axis: Estimated Opportunity
The horizontal X-axis, is a correlation between the threat actor’s capabilities and an organization’s vulnerabilities. We take the attack surface of your organization, your vulnerabilities, your gaps, and your exposures to overlay it with a threat actor’s capability, or ability, to perform certain activities such as a cyber attack. This gives you a representation of the potential threats directly to your organization.
From a technical perspective, we rank and total the number of events related to the threat actor that contain information/intelligence about their capabilities and select the ones that match the information available on the relevant watchlists such as Vulnerability, Method, and Tech Stack watchlists. From there, events are corroborated and calculated into numerical values, then plotted on the X-axis.
How to use a threat map?
A powerful visualization of your threat landscape and trends allows you to immediately identify threats that matter to you. The visual shows you the most dangerous threats and the threats that have an opportunity to harm you. It saves analysts time, helping them focus on what matters while assisting executives set strategies for mitigation or presenting relevant risks to the board. Teams can use a threat map to trigger hunt investigations based on levels of intent and opportunity or use a threat map to prioritize vulnerability patching based on the association of a priority threat actor. The list goes on.
Below is just one example, describing one way to prioritize prevention/detection activities based on the association with a priority threat actor.
- Step 1: Populate all Watch Lists that are available in your enterprise.
- Step 2: Identify priority threat actors on the threat map.
- Step 3: Click on each one of them to display the associated evidence.
- Step 4: Identify the opportunities related to the attacker and perform mitigation activities.
- Step 5: Pivot to the Intelligence Card by clicking on the name of the threat actor and identify additional Insikt Group® reporting, MITRE ATT&CK TTPs, indicators of compromise, and rules (Sigma, YARA) for prevention/detection/response against the adversary.
If you’re interested in seeing the new threat map in action, request a demo today or register to join our September 20th Live Webinar on Prioritization.
Related