10 Years of Building the Security Intelligence Graph: A Tech Retrospective

Recorded Future recently passed a big milestone, having reached an annual recurring revenue (ARR) level of $100 million — something very few SaaS companies ever do!
Now, 10 years into the life of Recorded Future (or 12, if you count a couple of years of prototyping in the virtual garage startup phase), we’ve decided that it would be a good time to do a brief technology-oriented retrospective regarding how we have built and continue to evolve our amazing product.
We’d like to address questions related to what we have done well and not so well, which good, early design decisions we made, what we could have done differently (had we known where we would be going), and what has surprised us the most over the years. We’ll start off with a brief introduction of what Recorded Future does, followed by a description of our high-level architecture, followed by deep dives into some technical areas of special interest.
What We Do at Recorded Future
To use a buzzword of the 2020s, Recorded Future is building a “digital twin” of the world, and that is represented in what we call our Security Intelligence Graph. Our overall ambition is to provide the most comprehensive security intelligence by collecting and analyzing a broad spectrum of information sources from all over the internet. Information can be text-based (blogs, social media, forums, etc.), as well as technical (e.g., domain registrations). From the start, our intent was to organize the internet for analytics — not only search. This meant that we needed to build a representation of all the information we collect that lends itself to both qualitative and quantitative analytics. This representation, the Security Intelligence Graph, is used to drive further analytics, our web-based and mobile interfaces, and our customer-facing APIs.
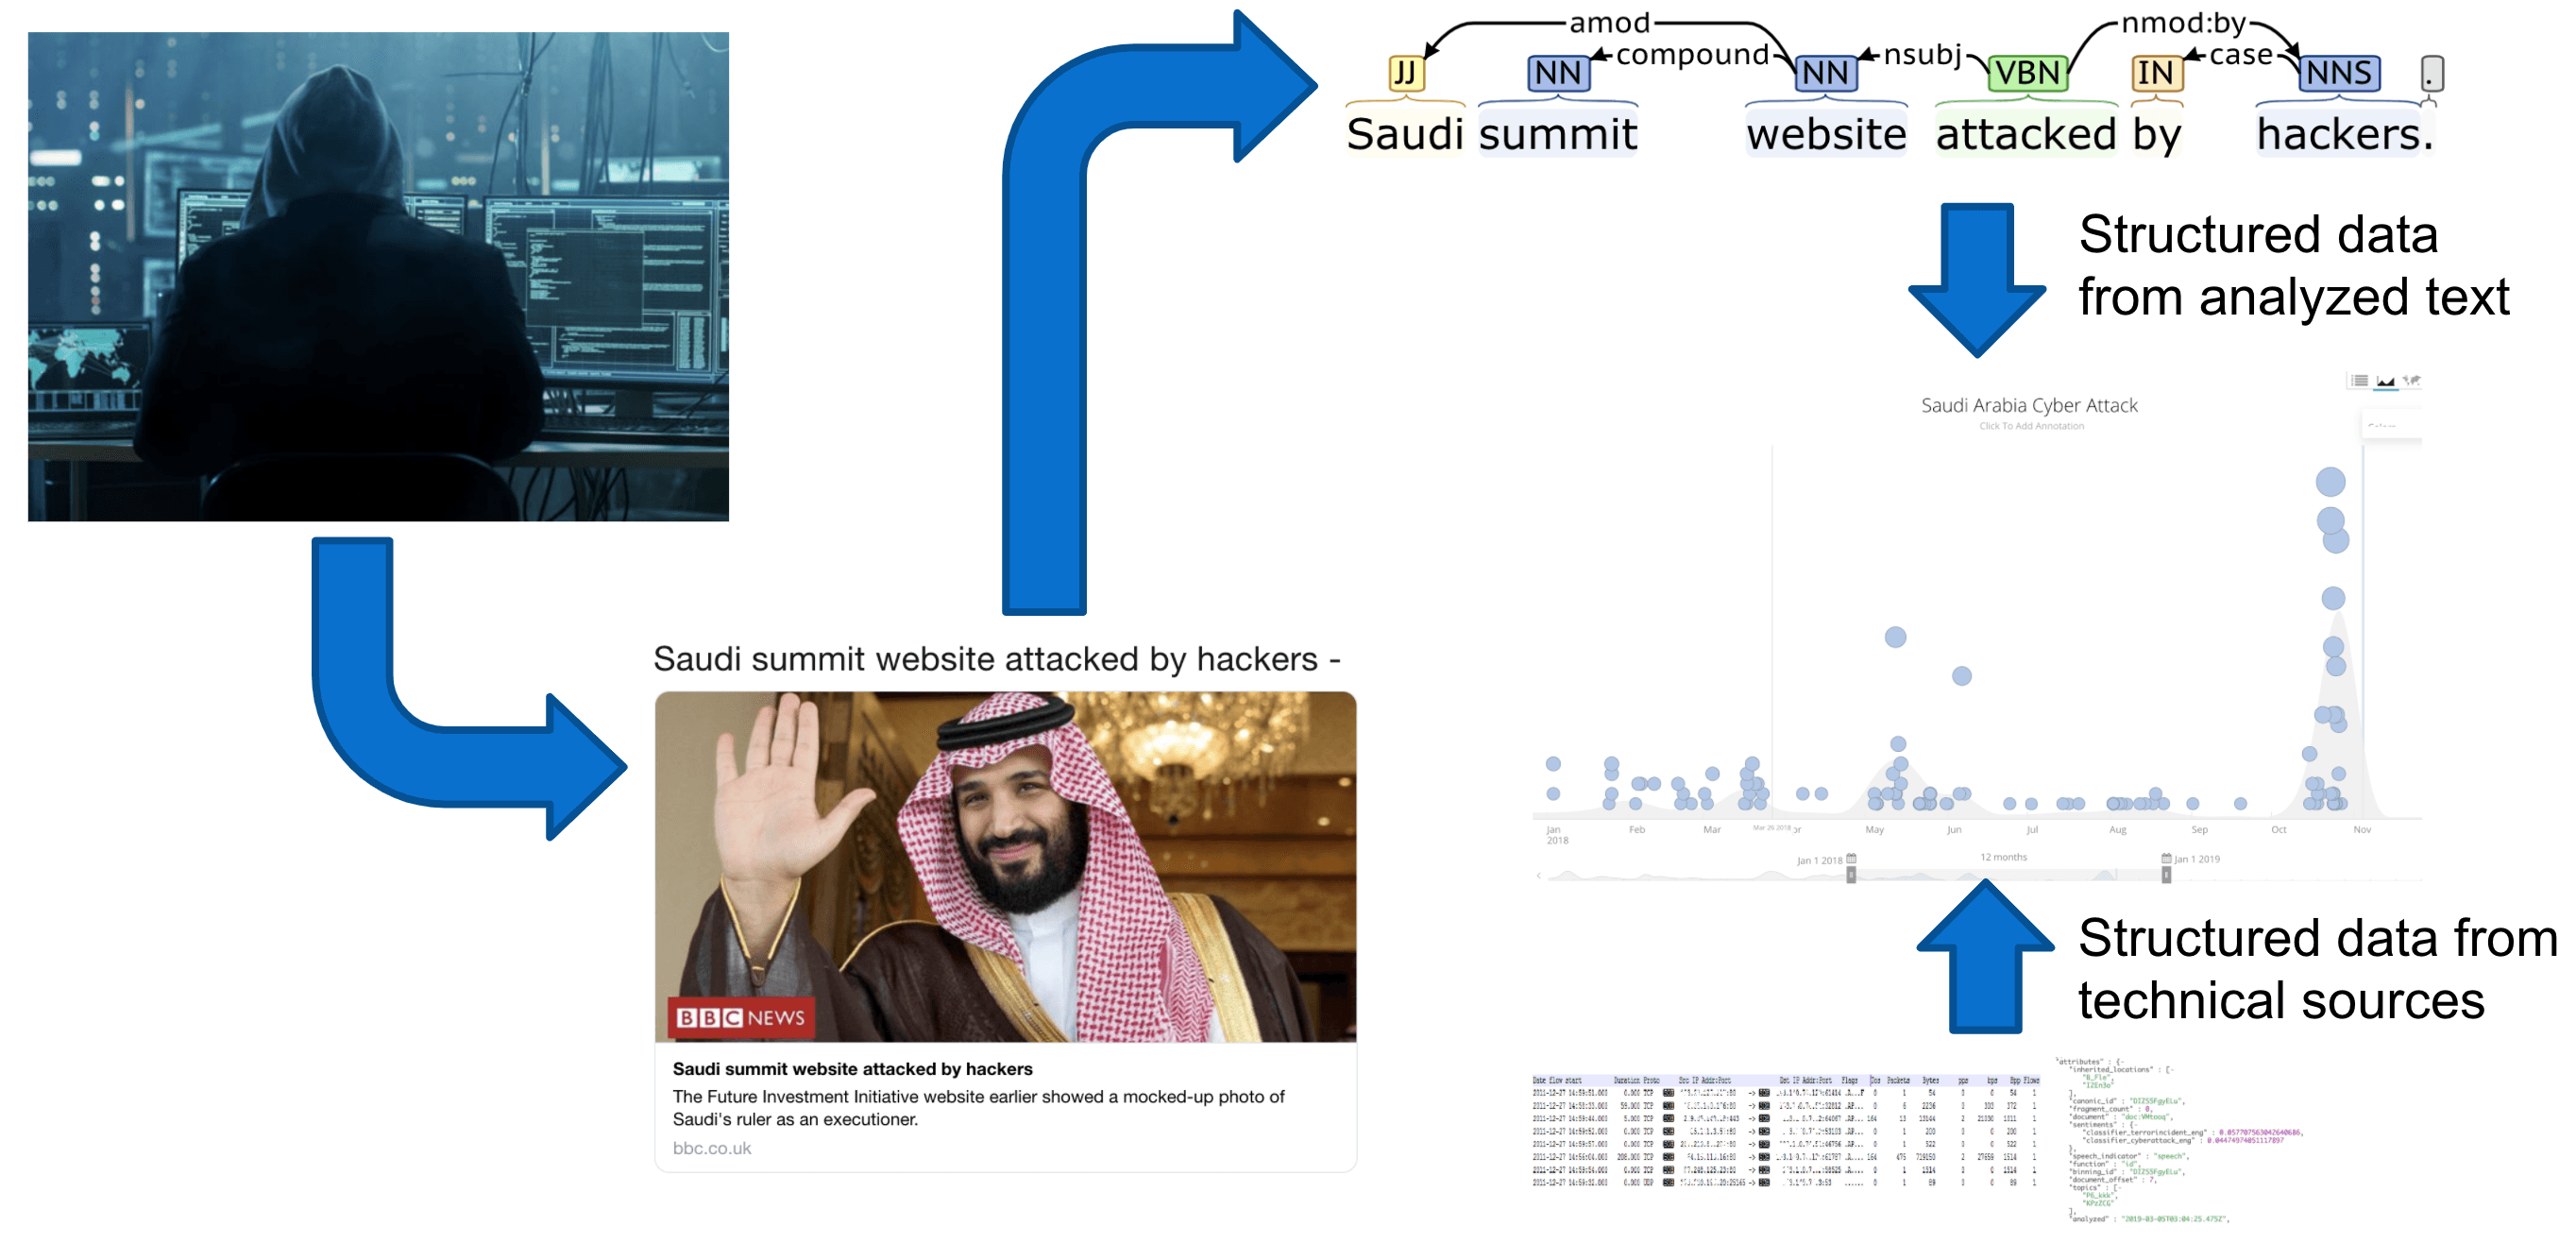
This combination of text-based and technical sources is used to populate the Security Intelligence Graph, from which we can draw some interesting results:
- As part of our work on building cyber-related ontologies, we have mapped out the digital assets of more than 150,000 of the world’s most important companies — this includes domains and IP address ranges owned by those companies, and much more.
- From malware detonation and other technical sources, we constantly get information about IP addresses that have been identified as command-and-control (C2) servers for malware. This set of known C2 servers is represented as a set of entities in Recorded Future, and is being constantly updated in real time.
- Using this list of C2-related IP addresses, we can acquire communication metadata, such as information about what other IPs have been communicating with these malicious IPs.
- Correlating this set of IPs (that have been communicating with malicious IPs) with the IP address ranges belonging to the companies collected in step 1 above, we can identify infected hosts inside these companies. This information then flows into our risk assessment system, and together with other indicators, allows us to assign an overall cyber risk score to a company. These risk scores are valuable indicators for the companies themselves, but can also be used to assess third-party risk (e.g., whether entering into a “digital relationship” with a certain company might increase your own risk).
The Recorded Future threat intelligence machinery operates automatically 24 hours a day, seven days a week, 365 days a year, collecting, analyzing, correlating, and evaluating information like this from all over the internet. Automating the tedious tasks of collection and fundamental analysis allows human analysts to focus their attention on higher-level aspects of risk. At the same time, information flowing from Recorded Future into other systems through our APIs increases the value of these other systems by giving them real-time access to relevant, high-quality data.
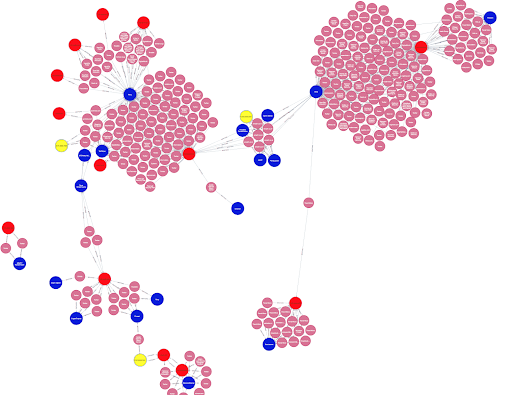 A small subset of the Security Intelligence Graph, showing relationships between malware (blue nodes) and vulnerabilities (red and yellow nodes) through mentions in references (pink nodes). For example, in the bottom right corner, a number of sources relating the Sora botnet to CVE-2020-6756 can be seen.
High-Level System Architecture
Our system architecture reflects the flow of information described above, from any source on the internet, and into the Security Intelligence Graph. Apart from some nomenclature, the system architecture described in our earliest patent applications1 — more than 10 years ago — is, at a high level, still remarkably similar to the current architecture.
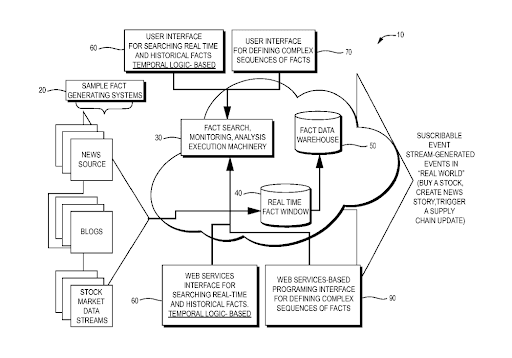
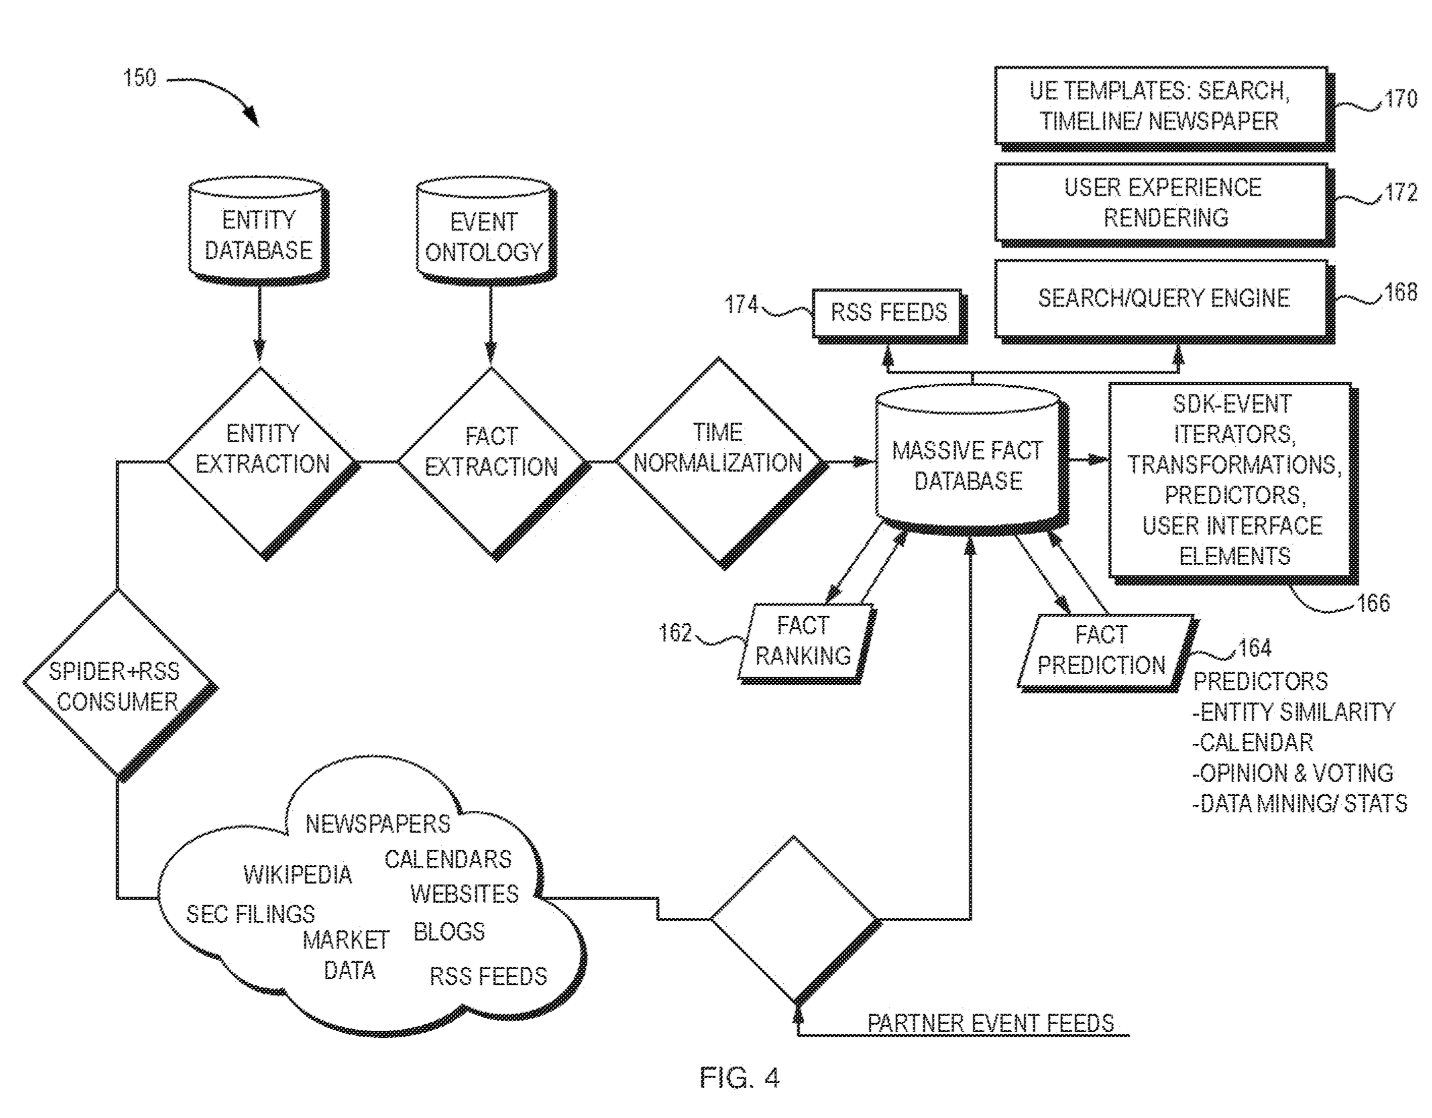 Original patent application diagrams.
A notable difference is that in the early days, we were entirely focused on text-based open source intelligence (OSINT). Today, we have an equally important inflow of technical sources, like domain and certificate registrations, DNS, WHOIS data, internet traffic data, and technical indicators gathered from malware detonation and other forms of analysis.
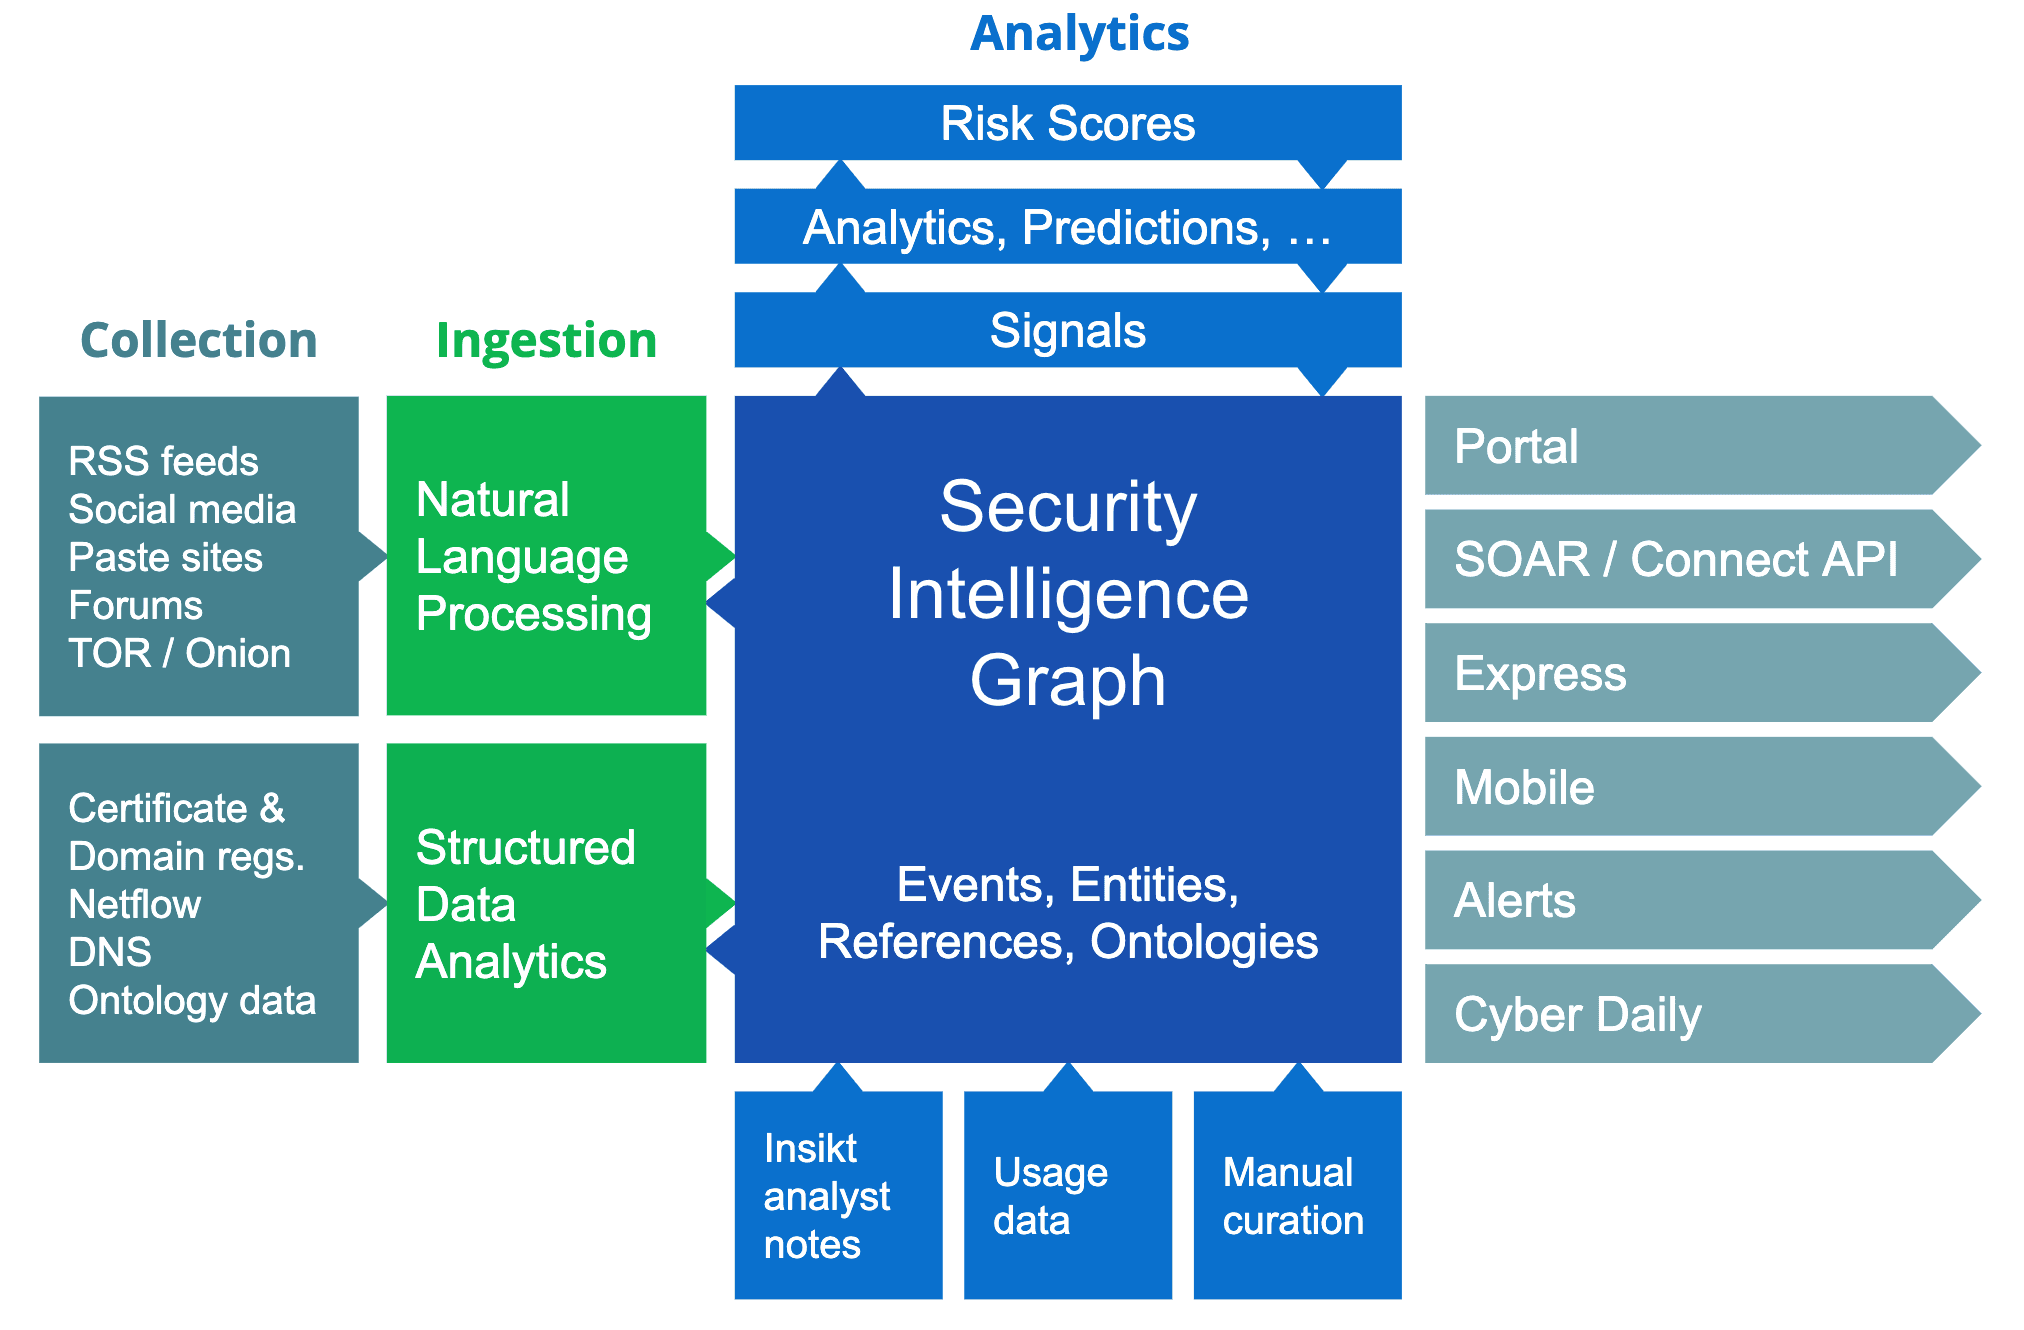 Recorded Future’s architecture today.
Cloud Native
Just like individuals tend to prefer the music we listened to as teenagers for the rest of our lives, our experience is that companies tend to stick with many of the technology choices they make early in life, sometimes to the detriment of adopting new technologies that would serve them better. We are lucky (or clever) enough to be “cloud native,” having started prototyping what eventually became Recorded Future only about two years after Amazon launched their Elastic Compute Cloud (in 2006), and modern cloud-computing services as we now know them became widely available.
After a few months of hosting on a small infrastructure provider, we moved over to AWS, and have been growing with it since then. Today, we run thousands of EC2 instances and benefit hugely from the elasticity, since the load from both our core analytical process and a lot of reanalysis work varies greatly over time. Being cloud native, we have never invested in a single piece of hardware, except for laptops.
Scalability
One of our motivations for starting Recorded Future was the realization that the internet had become the sensor through which you could get information about anything happening in the world, and this is of course only more true today than 10 years ago.
Even so, when we started harvesting information at “internet scale,” we didn’t have a clear idea of what data volumes would be needed to get a comprehensive view of everything happening in the world. However, armed with a firm belief in Moore’s Law, we decided to just start. Looking back now, we can conclude that a combination of advancements in hardware, software, and a lot of clever engineering has allowed us to scale to where we can today harvest more than 50 million documents per day from all over the internet (open and dark web, blogs, social media, forums, technical sources, and much more) and process them in real time. If you look at collection volume growth, measured in the number of references (our basic unit of information — think about it as one mention of one event in one document), we now collect just as much in only three days as we did in all of 2009! This growth stems from both adding an abundance of text-based sources and a multitude of technical sources.
Our total intelligence holdings today consist of more than 5.5 billion entities and more than 73 billion references, and is growing rapidly — doubling in size every 12 months or so. All of this data is instantly searchable in our portal and available through our APIs. Without a combination of Moore’s Law, the scalability of the cloud, smart algorithms, and clever tradeoffs between indexing time and search time computations, this would not be possible.
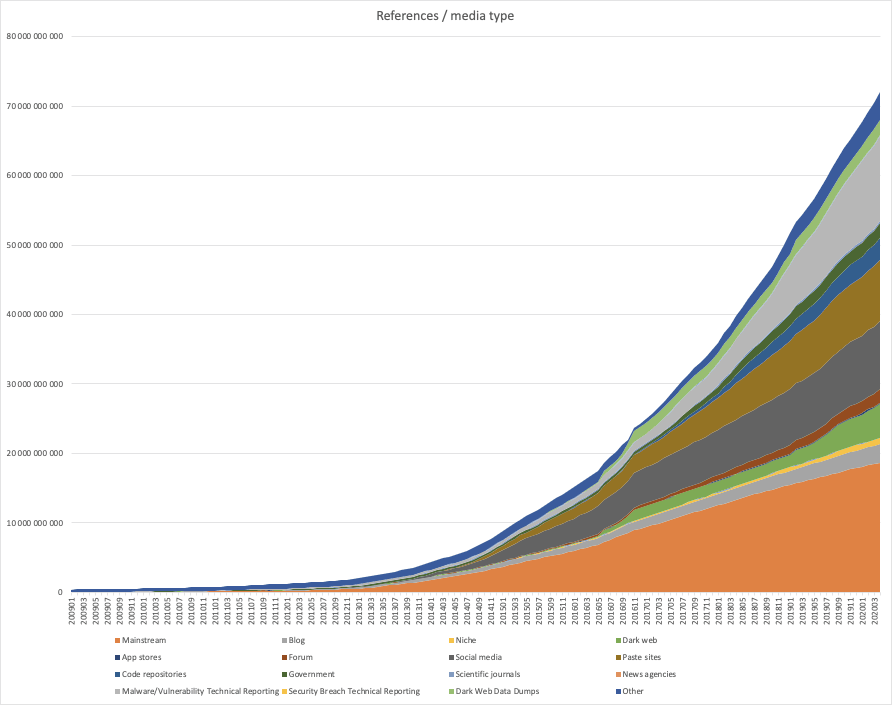 Growth of Recorded Future intelligence holdings over time.
Our scalability is based on the elasticity model of the cloud, but to realize these advantages, our collection and analysis pipeline has had to be adapted for it. Two main design principles have been used to build a scalable architecture:
- A pipelined architecture, where the collection and analysis chain is separated into separate processes, communicating over queues (using RabbitMQ as our message broker).
- Horizontal scaling of the different stages in the pipeline, using auto-scaling to adapt to the workload of the system (first using Gearman, then Asgaard, and today, a homegrown solution to manage auto-scaling).
This architecture has not only given us a scalable and robust architecture, but it has also allowed us to be very cost efficient, using (comparatively) cheap spot machine instances for autoscaling.
Databases and Indices
As described above, our intelligence holdings have grown tremendously over time. In fact, the Security Intelligence Graph has increased in size approximately 720 times over 10 years, or about 100% per year. Not surprisingly, we have had to go through several generations of database technologies to accommodate this growth. In the early years, we used MySQL for all entity and reference storage and search. We used bigger and bigger nodes hosting MySQL until we had to start sharding the database over several nodes. MySQL had no support for that which we could make use of, so we had to look at other alternatives. Using MySQL had other problems as well. For example, we need to support flexible variations of search, which with a relational model requires deep joins. With a growing data set, the joins were seriously degrading performance and that made it hard to shard the data over multiple nodes.
In 2010, we designed a denormalized model, eliminating the need for joins. When indexing, we expand records following our ontology, using both anonymous and specific relations into paths, and those paths express all the ways we want to be able to search, as specified by our ontology model. The model describes event types, entity types, their relations, and what search paths should be supported. Instead of using deep joins, we can just search for paths in a single index. This allows us to see a huge improvement in search time, but comes at a cost in regards to indexing time, and especially for re-indexing, when we have to adapt the index to ontology changes.
At this same time, we moved over to Sphinx, a free-text search engine that matched our new denormalized model well. Sphinx had support for mapping the denormalized vectors as text, but it had no range search for numbers, so we had to map our date range searches into hierarchical text searches. We also had to build operational tools for sharding the index over several nodes, with extra care taken to get near-real time search capabilities. Sphinx indices only contain index data, not payload data, so at that point, we had to move the data contents to MongoDB (later AWS S3). When searching in Sphinx, the result is a number of document identifiers which are then looked up in MongoDB to get the actual content.
A few years later, we moved from Sphinx to Elasticsearch, which gave us several advantages. Elasticsearch has built-in support for automatic sharding, replicas, and failover, so this switch was a huge win operationally. Elasticsearch, built on top of the search engine Lucene, is also much more efficient than Sphinx and supports number range searches and aggregations. The index can also contain payload content, so we moved back to having the content in the index. We may want to revisit this last decision, as it’s possible that it would be more cost efficient to once again use a separate key-value store for content. For now, we use this combination of S3 for long-term reference storage, MongoDB for entity long-term storage, and Elasticsearch for both entity and reference search.
The early decision to use a well-defined API and query language related to our data model has allowed us to replace the data storage and index solutions without having to change any code in internal or customer applications that use the API — something that would have been much harder if we had exposed the query language of the underlying search engine in our APIs.
APIs
Early on, we designed a query language that suited our data model and use cases well. Queries and responses are expressed as JSON documents. The language is very expressive, allowing flexible queries. This query language has served us well over the years, but querying in it requires a good understanding of our data model, and many people found it to be too complicated.
At one point, we therefore decided to move clients over to a simpler REST-based API, tailored for our clients’ use cases. These use cases increasingly consist of automated integrations with other systems. We called the new API the Connect API. The original API and query language were renamed to the Raw API. The Raw API, with its complete expressive power, is now mainly used internally for analytics and as an intermediate query language between processes.
Going forward, we envision exposing many more external APIs, tailor-made to handle the use cases of the various modules of our product support.
In addition to external APIs, we of course also have numerous internal APIs for ingesting and curating data, logging and analyzing system behavior, and more. Even when you build internal APIs, it’s good to have several users involved and use cases in mind to make you think twice about what the APIs need to offer. In the absence of external customers, it’s a good idea to start thinking of your internal users as “customers” — which they are!
AI, Machine Learning, and Natural Language Processing
From the start, artificial intelligence (AI) related technologies have been a key component of the Recorded Future technology stack. First and foremost, our ontologies and our fundamental data models are inspired by knowledge representation and other ideas developed by early AI research. Some of our more fundamental natural language processing (NLP) components, such as language classification and named entity recognition, have from the start been based on statistical methods and machine learning. For these basic NLP services, we have always partnered with Basis Technology, and their Rosette platform has helped us to quickly add support for more languages. For special domains, like cyber, we complement the Basis platform with entity extractors developed in house. Some other key components of our NLP, like event extraction and temporal analytics, were entirely rule based from the start, however. Our first experiments in predictive analytics used machine learning algorithms developed for applications like predictive maintenance.
When the modern deep learning revolution started around 2011-2012, we started investigating how this could be used in our system. Today, we are busy moving our event extraction framework over to machine learning, and new event extractors use deep learning both to classify events and to decide what roles different entities take in events. Although this switch has not shortened the time needed to develop new event detectors, it has reduced the need for programming skills, and therefore allowed us to make greater use of language and domain experts in developing these new extractors.
The biggest recent impact of machine learning algorithms is on predictive analytics, however. Today, we can compute predictive risk scores for IP addresses and domain names, allowing defenders to have a chance of anticipating the next move by attackers and not just reacting to already executed attacks.
Another good example of how we use AI technologies is machine translation, allowing our users to easily gain insights, despite not mastering all languages in which we collect text. For machine translation, we’ve used an external service rather than develop it ourselves, and we have benefited from its improved quality and language coverage over time. So far, even though it has improved a lot, we do not think machine translation quality is good enough to allow us to convert text to English and use our English event extractors. We are, however, starting to use machine-translated and human-curated texts when training new machine learning-based event detectors.
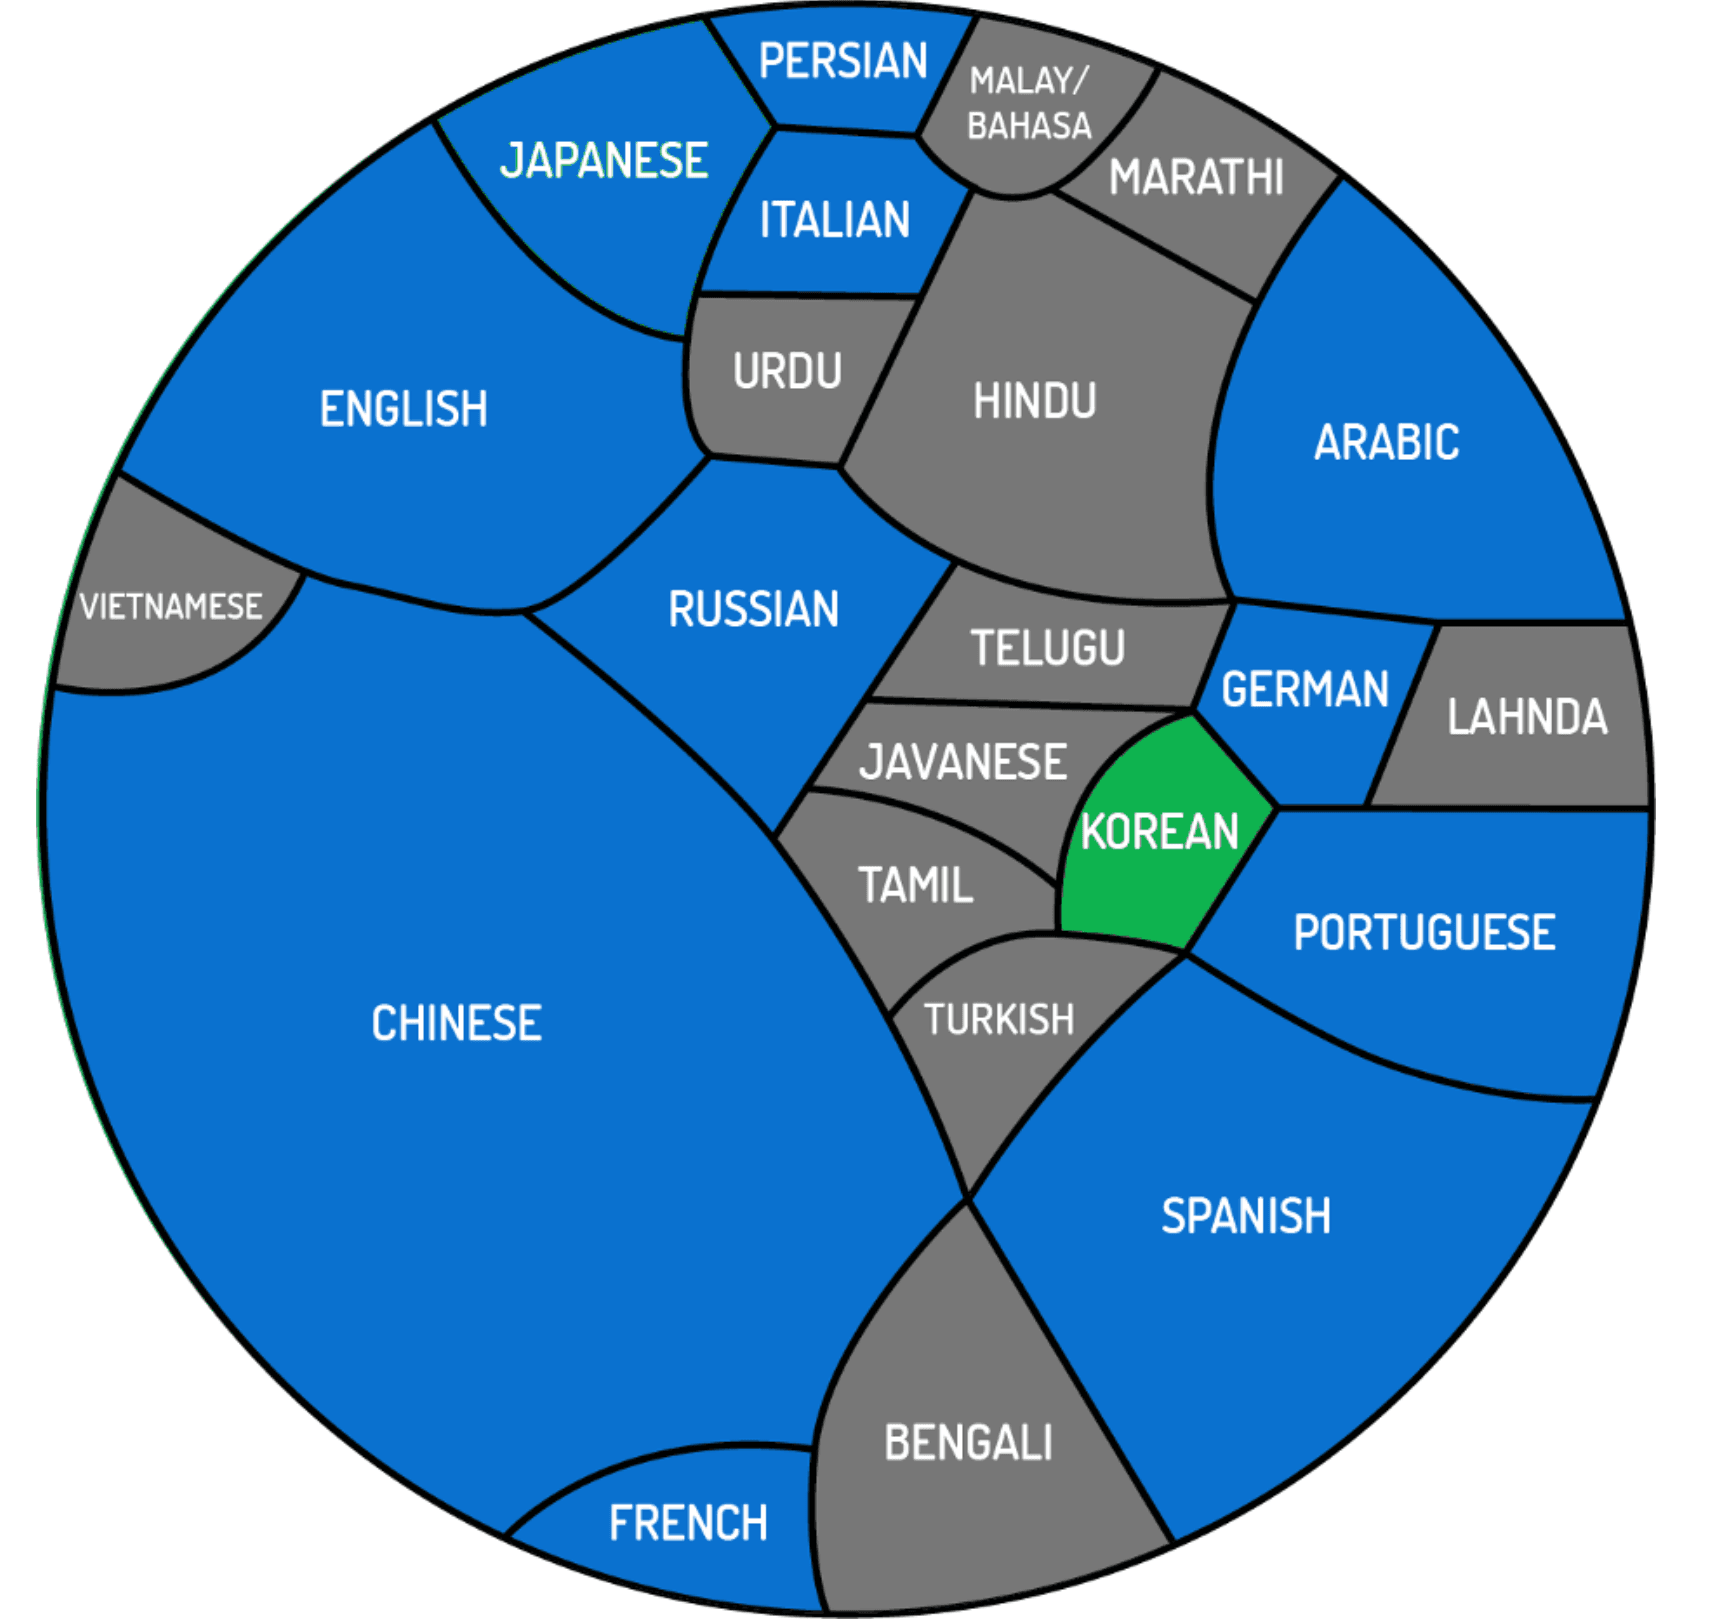 Current languages where we do deep semantic analysis (blue) and next in line (green). Together with the remaining languages in gray, the circle represents the 4.1 billion people around the world who speak one of 23 of the world’s most-spoken languages as their native tongue. The size of each block is equivalent to that language’s share of native speakers. (Source: Bored Panda)
For machine learning, choosing and evaluating different algorithms is just a small part of the job. Recently, we have invested a lot in building a complete tool chain for extracting training data, keeping track of annotators and annotator agreement, model evaluation, and more. Such software engineering-related aspects of building machine learning-based systems are still often overlooked, but crucial for building operational systems and improving them over time.
Ontologies
The ontology part of our Security Intelligence Graph is where we represent relationships between entities. Examples include which companies provide which products, how different technologies are related, which malwares exploit which vulnerabilities, and what geographical entities are located in which country (and much, much more). These ontologies have grown over time, and today contain billions of relationships. We build these ontologies using a combination of available data sources like Wikipedia, Geonames, Openstreetmap, in-house developed data sources, and in select cases, human curation to ensure the highest possible quality. It’s worth noting that both public domain and commercial data is, not surprisingly, noisy and incomplete, so without humans in the loop for the crucial parts of the ontology process, quality would not be good enough. A key insight here is that when working with huge ontologies, just having tools that can point human curators to where they should look is of great help.
Since these ontologies describe our ever-changing world, our processes and tools for continuous ontology improvements have become a crucial part of our toolbox.
Programming Languages
Looking a bit more under the hood, another way to illustrate the evolution of our R&D efforts is to look at the distribution of different programming languages used in our product portfolio. From day one, we developed our core backend services in Java, our UIs in Javascript/HTML, and our operations/DevOps systems in Ruby. Over time, more and more backend services have been developed from scratch in Scala or converted from Java to Scala. This transition is not very visible in the charts below, primarily because in our experience, Scala code is so much more expressive and compact than Java. The most dramatic increase in language use is Python; this reflects our increased efforts in data science and analytics, but also a move from rule-based to machine learning-based methods in our core natural language processing and data analytics pipelines.
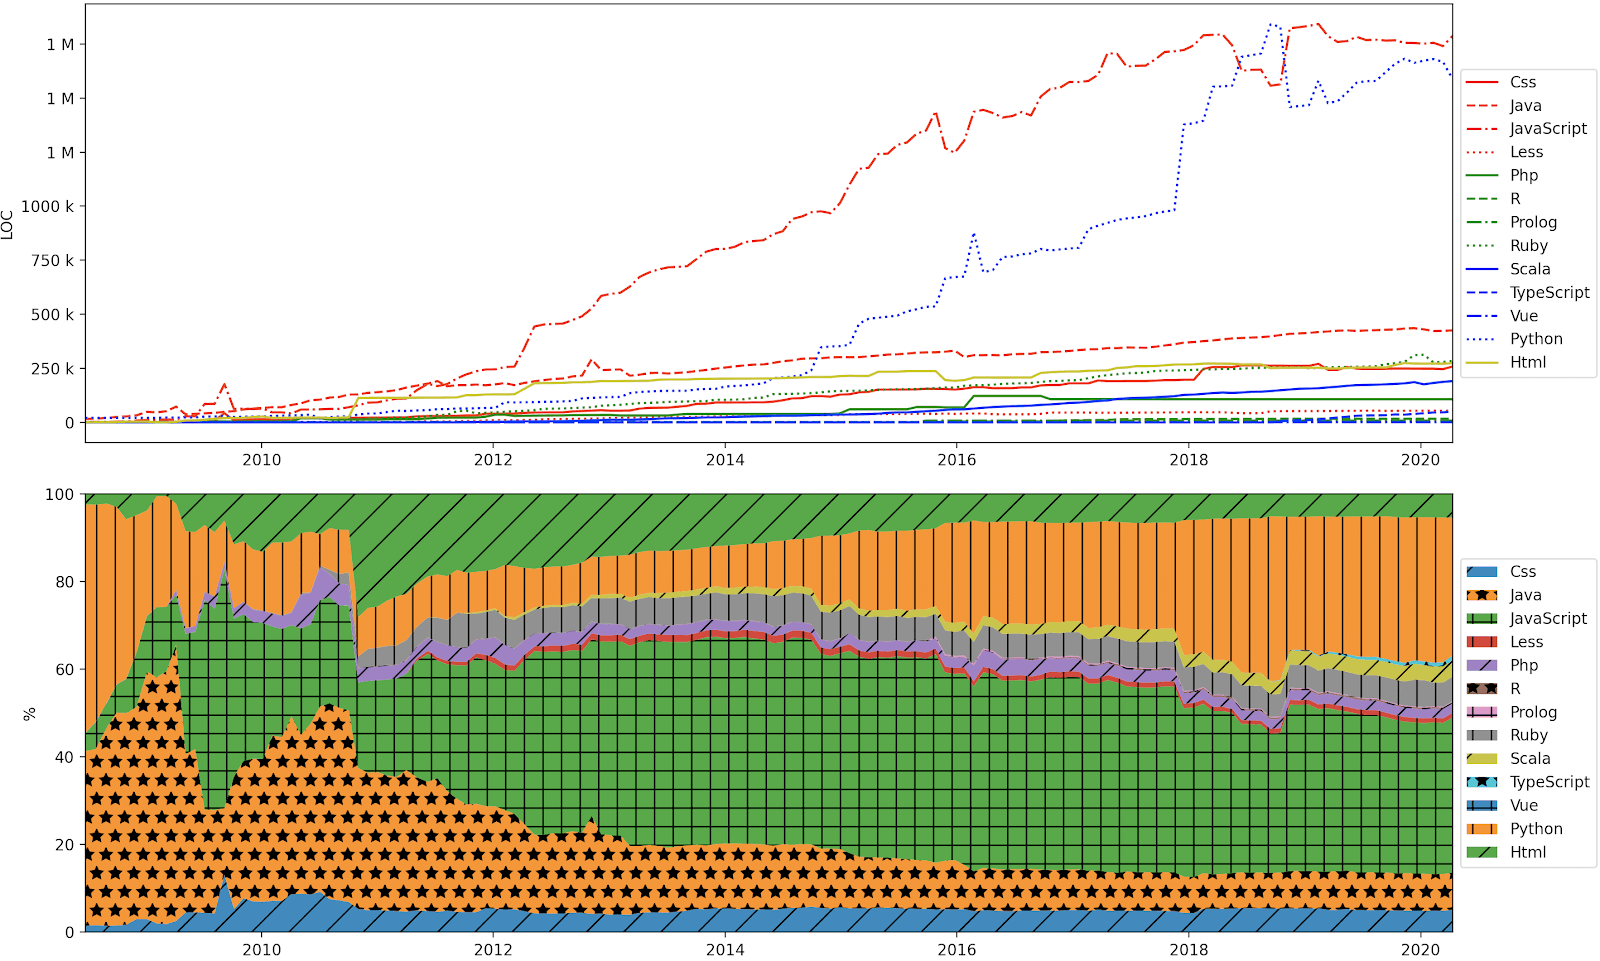 Use of different programming languages over time, described both in absolute number of lines of code and relative values.
Some Lessons Learned
Trying to summarize what we’ve learned from 10 years of hard work is not easy, but here are a few conclusions, divided into the good, the not so good, and the surprising or unresolved questions.
Good Things We’ve Done
- Choosing a simple, general data model and using a metadata-based description of that model has allowed us to evolve our ontologies and event representations over time. The underlying database and search technologies have changed, but by using APIs to abstract away from this, we have been able to reduce the disruptions caused by changing underlying technologies significantly.
- Deciding what to build on our own and what to license or use from open sources has been key to being able to build a very complex product with reasonable cost. Sometimes we’ve started out with an open source solution that allowed us to do some rapid prototyping, but to get to “industrial strength,” we’ve then had to reimplement things ourselves. Having prototyped first “for free” has often meant that we’ve been able to shorten the overall development time.
- Given that technology develops at such great speed — thank you to all the clever engineers out there — if you want to build a cutting edge product, you have to make assumptions about what future problems will be solved, such as through improved performance of future products. We realized our data assets would grow exponentially over time, but we assumed part of that challenge would be solved by matching performance improvements in underlying technologies — fortunately, that has so far turned out to be true!
- Our decision to run everything in the cloud from the start is something we never regret. Every now and then, we discuss moving to some hybrid solution, but when we start calculating how that would affect our total operations costs, including personnel, we quickly move back to cloud only. We make very efficient use of the AWS infrastructure (including spot instances) thanks to our asynchronous processing pipeline and horizontal scaling on cheap machines — this also gives us a very robust system.
Things We Could Have Done Differently
- One of our early decisions on how to analyze text was to build a model based on the semantic meaning of sentences. In retrospect, having entire documents, or at least regions of documents, as the organizing entity could have made more sense (since descriptions of events can often spread over several sentences). The jury is still out on this one!
- Our text and data analysis pipelines are, well, pipelines. Their serial nature means that decisions made early in the analysis pipeline cannot be reevaluated, even if new information emerges in later stages. We have been discussing moving to a blackboard model or at least allowing feedback loops, but have not yet taken that step. As we continue to evolve our system to reasoning more about data we anticipate this change will eventually happen.
- We were perhaps a bit late in jumping onto an analysis model based on machine learning, and are still a bit too heavy on the rule-based side. However, it is our firm belief that just like humans most likely use a combination of quick “neural network” based analysis and slower, rule-based logic reasoning, our system will continue to be built using both paradigms (read Kahneman’s “Thinking, Fast and Slow” if you haven’t already).
Eternal Questions and Challenges
- Based on our long history in interactive information visualization, we have argued that our user interface must be able to respond with rich, relevant data in less than one second, irrespective of the query. This eternal hunt for a one-second response time is still on! In part, we have been quite successful — our Intelligence Cards today give rich, aggregated information in typically less than a second. This is achieved, again, by sacrificing resources for collection and index time for the benefit of faster lookups. Given that we have grown by a factor of one thousand or more both in data size and number of users, one might think that we could be excused for not always being responsive enough in delivering some of our more information-rich views. Both we and our users agree, however, that an efficient man-machine interface has to deliver instant feedback, so we keep working on it!
- We have always struggled to find the right data model for describing reality and the world around us. Given that philosophers have been attempting to do this for thousands of years, we are not worried that 10 years hasn’t been enough for us to come to a final conclusion, and we keep working on it. Given the diversity of data and the many different use cases we want to support, we probably need a few different models for representing all the information we have.
- Finally, the magic richness of human language and the challenge of building a machine that can understand and interpret it correctly will keep us busy for a few more years. We never cease to be amazed by how much time we can spend discussing seemingly simple problems, like how to interpret time expressions!
Closing Thoughts
We’ve had a great time building Recorded Future and its products for more than 10 years, and there is still a lot of exciting stuff left to do.
Why do we keep doing it? Well, in the words of JFK:
“We choose to go to the Moon in this decade and do the other things, not because they are easy, but because they are hard; because that goal will serve to organize and measure the best of our energies and skills, because that challenge is one that we are willing to accept, one we are unwilling to postpone, and one we intend to win, and the others, too!”
Footnotes
1 INFORMATION SERVICE FOR FACTS EXTRACTED FROM DIFFERING SOURCES ON A WIDE AREA NETWORK, US Patent 8,468,153 B2
Related