Quantifying Protests Around The World

At Recorded Future we track planned events by identifying future dates and periods of time from online media. One type of event that we track is protest activity, and you can see an example showing planned protests mapped by location on our site.
We’ve also been examining protests during the last 12 months en masse. To let others explore what we are seeing in that data set, we have published an analysis to the TIBCO Silver Spotfire cloud that displays the intensity of protests in various countries over time.
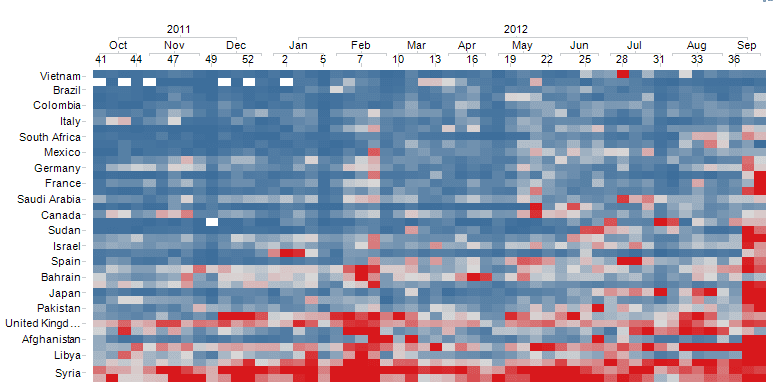 Global Protests Heatmap
Some trends are obvious. The recent outbreaks in Libya and Egypt light up in bright red and you can see the reach of these protests spanning a wide set of countries. During the same recent timeframe, we also see high levels of protests in China and Japan. Further back we can bursts of protest activity in Canada (May 2012), Greece (February 2012), and the UK (November 2011) to name just a few.
The number of protest events over time can also be helpful in understanding what countries are more or less tumultuous. From the top 50 countries sorted by number of reported protest events, we find activity in UAE, Malaysia, and Kenya to be relatively low while Egypt, Syria, and China experienced the most protests.
At an atomic event level, it’s interesting to see what was driving events in specific countries at different points in time. We present the top terms associated with protests in the visualization environment to serve this goal. Click on a node in the Heat map and you can see a display of terms referenced related to protests in the selected country during a particular week.
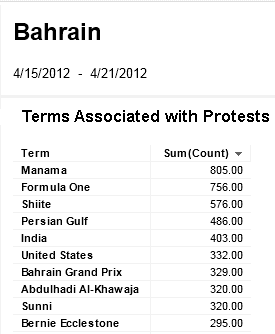
For the above example, we drilled into a particularly “red” week for Bahrain from mid-April of 2012 and discovered that the protests at that time were related to a Formula 1 Grand Prix race.
The interactive visualizations are publicly available and will be updated going forward as we collect additional data. Take a look at the analysis in the TIBCO Silver Spotfire cloud and let us know what you find!
A special thanks to TIBCO for hosting this analysis for us, and please get in touch if you’d like to conduct your own analysis using Recorded Future’s temporal analytic data.
Updated 8 October 2012 – some readers have noticed that this analysis doesn’t include a row for the United States. The results for protest events which referenced the US were dominated by protests that occurred outside of the US. That signal drowned out signals specific to protest activities within the United States, such as the Occupy movement. Because the signal was a less clear reflection of signals for other countries, we chose to omit it.
Related