Patterns in Physical and Digital Protests

This post was originally published as Activism OSINT: Why Are Cyber and Physical Protests Out of Sync? at the Recorded Future blog. Below is an excerpt from that post:
At Recorded Future, we collect and temporally organize an enormous amount of data on events around the world. Two types of events that stand out from recent times are displays of social unrest in the form of riots and demonstrations and various forms of cyber or malware attacks. We’ll use this post to look for patterns in frequency and typical timing of events for both.
Real Life Protests
First, let’s look at the weekly pattern of Protests from 2012 until now (Note: The time is actual event time , not publication time, so the pattern should not be based on news cycle). The Y-axis is relative count across the dataset. This spans lots of globally collected media data so the pattern stands out: Protests peak on Friday, stay high over weekend, and level out by Monday. We see the lowest level on Thursdays.
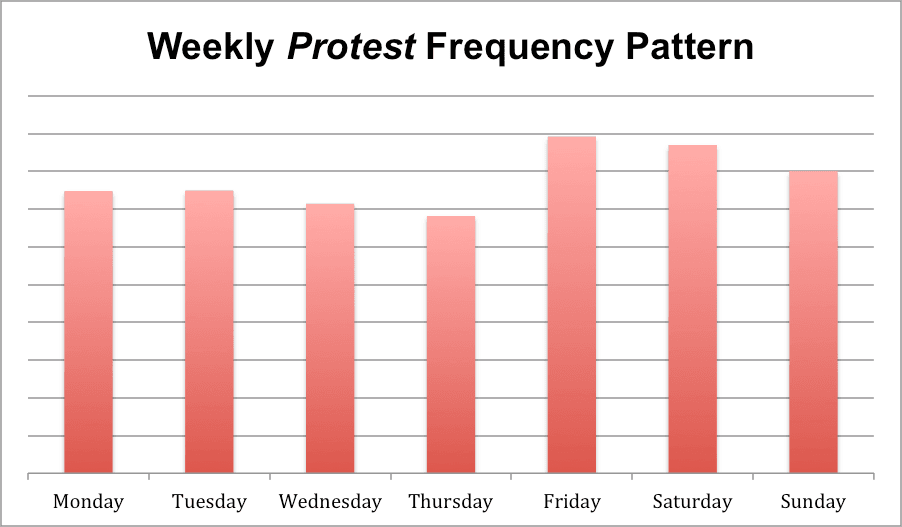
What might be driving this pattern?
- Fridays are obviously a popular day to protest. This might be heavily weighted by Days of Rage in the Middle East and North Africa during last couple of years.
- Given the peak on Fridays followed by monotonic decrease across the week – are we really seeing new memes emerging on Fridays followed by being executed across the week?
- Saturdays and Sundays are also popular – might be as simple as people being off work and having time to protest? Less conflict with personal life and better chance of catching the media.
This data begs for breakdown by geography to capture cultural nuances, weekend shifts (Christian, Muslim, Jewish, etc.). We’ll be back with that!
Cyber Attacks
Let’s next look at Cyber Attacks across the same timeframe of 2012 through today and show the relative level of attacks by day derived from loads of data and incidents. And now it gets interesting: we see an inverse pattern compared to the Protests data. Weekends stand out as a total low point while Tuesday, Thursday, and Friday stand out as highpoints. Saturdays are at half (!) of Tuesdays.
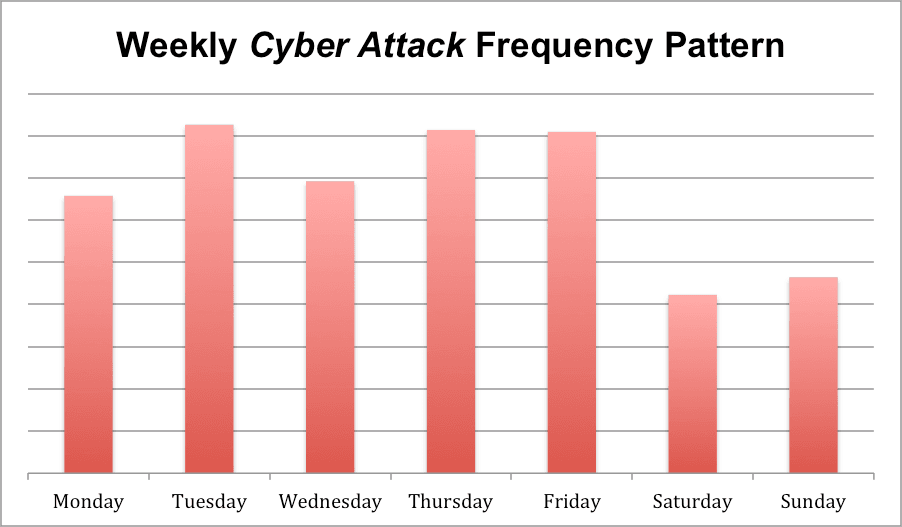
So, what’s going on?
- Are hackers focusing on writing/testing new approaches over the weekend and getting ready to unleash attacks when work week start?
- For DDoS attacks and other attacks on public facing systems like online banking, etc. – the maximum perceived impact might be during the work week. Basically – DDoS attacks etc. essentially are service disruption “protests” to say financial and public sectors. Further the lower traffic during weekend enables a target to better handle DDoS, with faster alerts and better accommodation of the bandwidth issues these attacks generate. It’s simply easier to handle them over a light workload on a weekend day.
- Are things actually happening over weekend, but they are not just noticed until the work week starts? If true, this may indicate a need to staff that watch center differently.
This data is ripe for breaking down and measuring by attack types – DDOS (and other activism oriented type of attack) vs. criminal activity vs. information warfare. Likewise patterns of groups like Anonymous vs. Al-Qassam Cyber fighters would be highly interesting.
Lots of additional analysis to be done, of course, both with hourly, daily, and monthly patterns as well as trying to literally tie patterns of “activism cause” attacks across physical and cyber world that identify temporal signatures. We hope this gives you a high level sense of the possibilities of studying open source intelligence on Protests and Cyber events and actually evaluating it analytically (!), not just reading news stories.
See the original post on the Recorded Future blog, and learn more about the company and its web intelligence tools by joining their webcast “Signs of Social Unrest in Social Media” on Wednesday, April 10.
Related