Untangling the Web with the Recorded Future Network Graph

Take a moment to consider how much of the what you read on the web every day is skimmed, skipped or forgotten. Given the force of the fire hose, it’s inevitable that details escape us. Yet, research tasks often require the arduous recall and contextualization of bits and pieces collected from large swaths of the web.
We’re introducing our newest Recorded Future visualization with that pain in mind. Adding an interactive, time-based network graph to analyze our index containing billions of events referenced on the web provides an easier way to answer some big questions.
Let’s take one example, and say you need to identify the technologies top mobile operators have been mentioned as using over the last twelve months. The results of this request in Recorded Future are below.
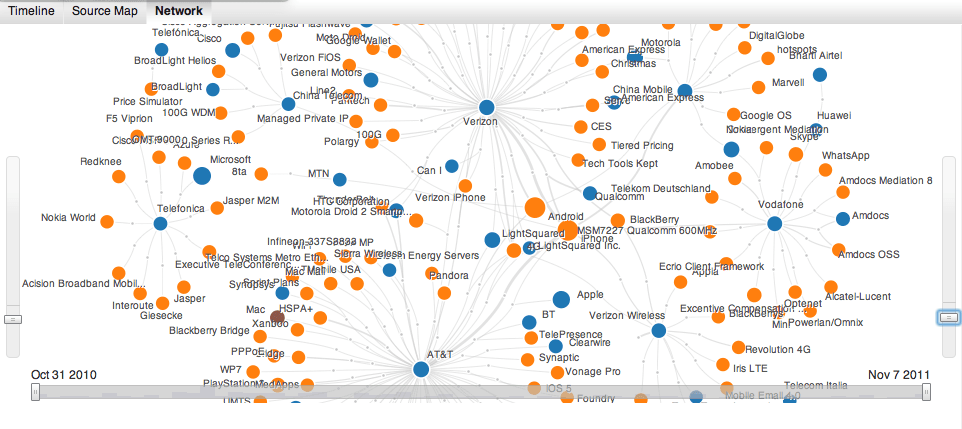
Clearly, there’s still work to be done in actually identifying what would be most relevant to the goal of our research, but in seconds we’ve generated a map around technology investment for major players in the mobile market!
A few details about what you’re seeing in above network graph:
Colored icons represent entities (companies, people, products and places) while grey lines show the events connecting those entities.
Beneath the network is a slider that filters results based on time. Designed for exploring how a network evolved or appeared during a particular timeframe.
Selecting any of the icons highlights relevant connections and displays the underlying sources.
Get all the details in our short intro video below, and when you’re ready to give it a try, sign up for a free trial of Recorded Future!
Related