Give Your Cyber Intelligence Dashboards a Facelift With These Advanced Chart Types
This is the third post in our blog series, “Visualizing Cyber Intelligence.”
In the cyber security world, charts and dashboards are indispensable. Yet, few analysts take the time to consider which is the right chart to use for the job at hand. In this post, we look at some commonly used charts, as well as advanced chart types that can turn you into a cyber crime-fighting superhero.
This post covers three types of dashboards a cyber intelligence analyst uses on a day-to-day basis:
- Static
- Interactive
- Executive
Static Dashboards
These dashboards are used to display a very specific section of the overall pool of data to the analyst. Static dashboards focus on past information, and can be generated ad hoc (when needed) through applications, or on a scheduled basis via email.
It’s good to stick with the basic chart types for static dashboards. These include the bar chart, line chart, and pie chart. Bar charts are great for comparing multiple values, and spotting outliers. Line charts are ideal for doing time-series analysis when you want to spot a trend over a period of time. When using a line chart, one simple yet powerful technique that helps read the data better is to add a trend line.
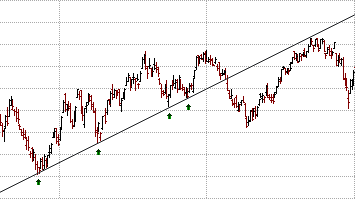
Popular among stock analysts, trend lines make it easy to spot variations in data over time, and identify how quickly a metric rises or falls.
Pie charts tend to be commonly used in dashboards. However, as a word of caution, they’re only somewhat helpful if they have up to three to four slices, and become almost impossible to read as the number of slices increase.
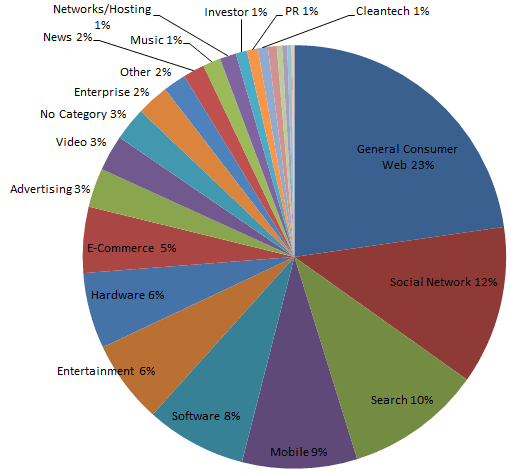
Though colorful, this pie chart is cluttered, and doesn’t help read the data. With that said, you may want to consider replacing your pie charts with bar charts. You’ll be able to understand your data better, and your dashboard will still look great.
Interactive Dashboards
Raffael Marty, author of Applied Security Visualization, says the purpose of dashboards in cyber security is “to understand the current state of systems and applications, and presently ongoing tasks or events of interest.” To do this, the security analyst relies not only on static dashboards, but on interactive dashboards that allow slicing and dicing of data.
Let’s say you’ve spotted an anomaly in your weekly report, and want to dig deeper to find the root cause, that’s when you’ll switch from your static report to a live application. Static dashboards enable you to spot problems, but interactive dashboards give you the information you need to resolve them. Interactive dashboards may contain data as recent as a few minutes ago, or even data that’s updated in real-time.
The basic chart types – bar charts and line charts – come in handy here too, but unlike in a static dashboard, they need to be augmented with interactive features like filter, sort, zoom, scroll, tooltips, and more.
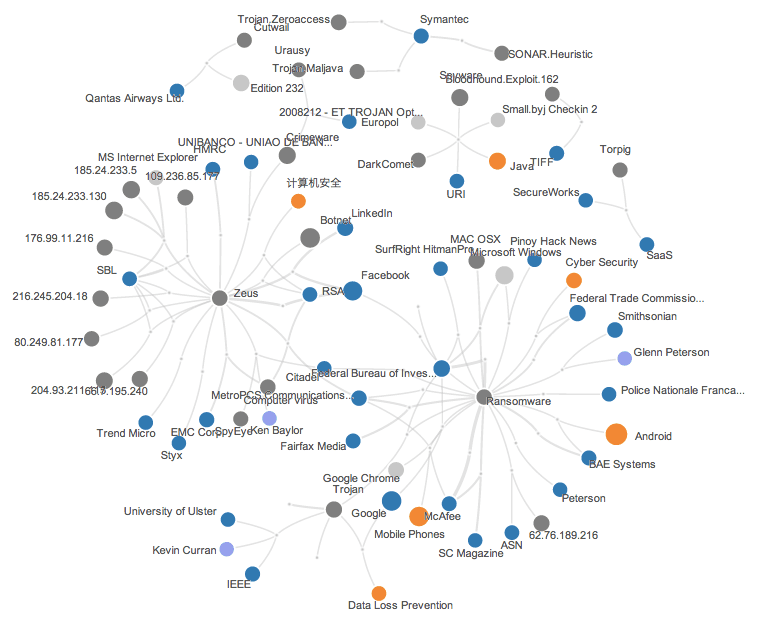
If you want to drill down to find the exact source of the issue, often, a network chart is the go-to-chart for the cyber intelligence analyst. A good network chart should be able to direct the viewer’s attention to the affected systems, or users immediately, and allow them to follow the nodes to the source of the attack, or issue.
Recorded Future has a great example of a network chart that allows viewers to trace the source and context of the issue. It lets you dig deeper by showing a rich tooltip (box) with minute details.
Executive Dashboards
While cyber security professionals may spend their time firefighting attacks, they always strive to influence their organization’s strategy. This is where executive dashboards come in.
Marty, in his book, says CIOs who use executive dashboards often comment, “Show me when my crown jewels are at risk.” CIOs want to see their most important business metrics at a glance whenever they need to. The dashboard acts like a thermometer showing vital health statistics for the entire operation. According to Marty, this gives the CIO “situational awareness” enabling them to “drive decisions and react to, or proactively address, upcoming problems.”
Here’s an example of an exemplary CIO dashboard created by the leading expert on dashboards, Stephen Few:
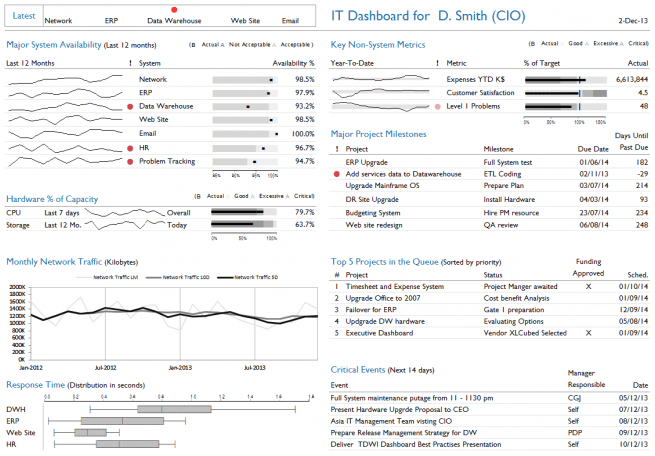
One of the many reasons this dashboard stands out is for its use of advanced chart types like bullet graphs, and sparkline charts. These charts are rarely used, but are one of the most effective chart types a cyber intelligence dashboard could have. They pack a lot of information in very little space, allowing the viewer to compare data points, and analyze the context in a matter of seconds.
As a take away from reading this post, do look at your cyber intelligence dashboards for opportunities to change the chart types, and interactive features in them. This effort will enable you to be much more efficient, and even uncover hidden opportunities from your data.
With that we come to the end of our “Visualizing Cyber Intelligence” series. If you enjoyed reading this post, be sure to catch up on the previous two posts as well:
Twain Taylor Twain Taylor is a guest blogger for Recorded Future. You can find more insight by Twain about the intersection between data visualization and big data on the FusionCharts blog.
Related