
Ransomware is the Scoreboard
Every Victim is a Verdict on Defensive Architecture
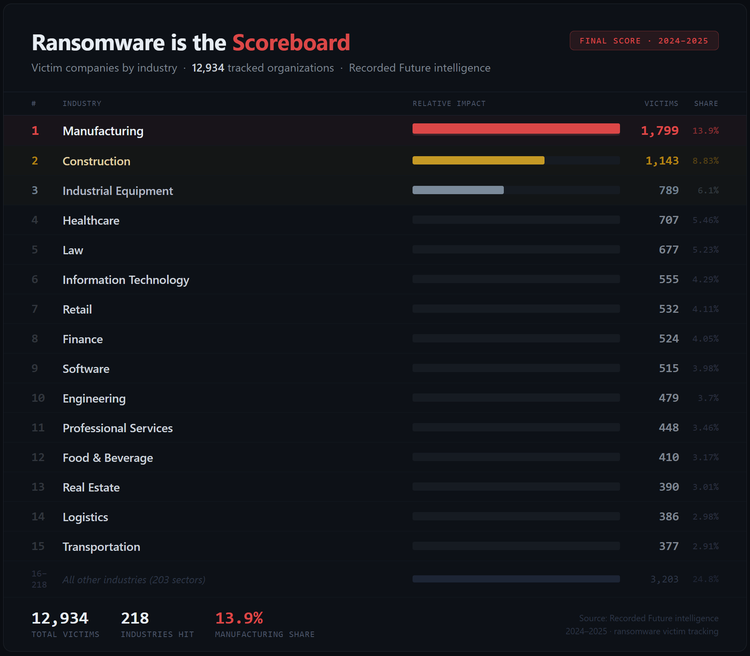
13,000.
That’s the number of ransomware victims Recorded Future has observed over the past two years.
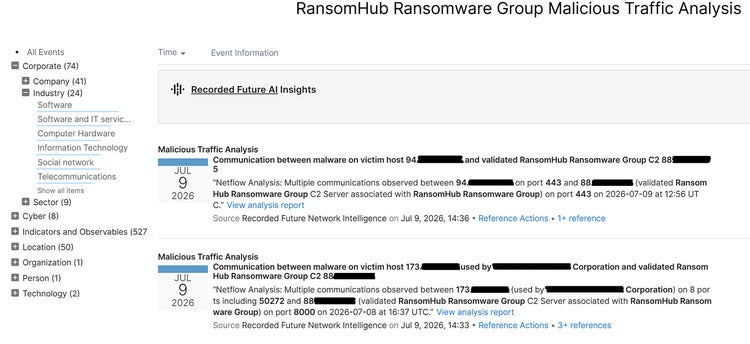
Watching the near-real-time ransomware attacks on businesses, non-profits, and government agencies has left me, like many security professionals and board directors, pondering how and why cyber defense keeps losing this particular fight. Adversaries like Interlock and RansomHub have continued their successful march to riches over the past 18 months. The multi-billion-ruble question is, “How?”
BloodHound and the defensive graph concept debuted over a decade ago and still maintain a vibrant open-source community. Continuous Threat Exposure Management (CTEM) (and attack path management) is an established cyber vendor category, yet ransomware crews are demonstrably eating many organizations’ lunch.
Let’s explore the problems (which are relatively easy to enumerate) and a solution (harder): modeling defense as the graph attackers actually traverse, at the speed they traverse it, which, of course, involves intelligence.
The Barometer
Ransomware is a solid barometer of operational defensive success, specifically because, unlike espionage, it’s noisy, financially motivated, and opportunistic. Certainly, ransomware also benefits from an optimal ecosystem, including payment economics, cyber insurance playbooks, and jurisdictional safe havens, which help incentivize ransomware gangs to find the cheapest attack paths. Relatively inexperienced actors can pick up commodity tools and reach the crown jewels. That highly repeated Ransomware-as-a-Service (RaaS) dynamic is a verdict on the availability of attack paths, regardless of payment incentives.
The prior two years of Recorded Future data revealed 834 unique ransomware families (or brands). The ransomware playbook is only becoming more effective over time, particularly as regional and industry-specific data privacy compliance regulations proliferate. The risk impact is now less about operational disruption, as offline backup resilience has increased, and more squarely focused on the legal or compliance failure of losing legislatively protected information.
What’s in a Graph?
It’s helpful to visualize an organization as an interconnected graph of nodes and edges, comprising hosts, configurations, credentials, and more. Adversaries attempt to traverse the graph and identify any available weaknesses that, when combined (via attack paths), lead to risk impacts.
If operational defense shifts focus from compliance-driven lists and categories, and we model the environment as a graph, will we better understand and remediate attack paths to prevent ransomware? Only if we can match adversarial velocity.
For an enterprise, the graph is combinatorially large, changes hourly, and humans can’t maintain or query it at the tempo at which attackers traverse it. Graphs provide the structure. Threat intelligence supplies the edge weights, and AI agents deliver the speed. In practice, that means agents recompute attack paths whenever the graph changes, test whether a newly reported adversary technique actually traverses your environment, and push the choke point to the top of the remediation queue, continuously, without waiting on an analyst.
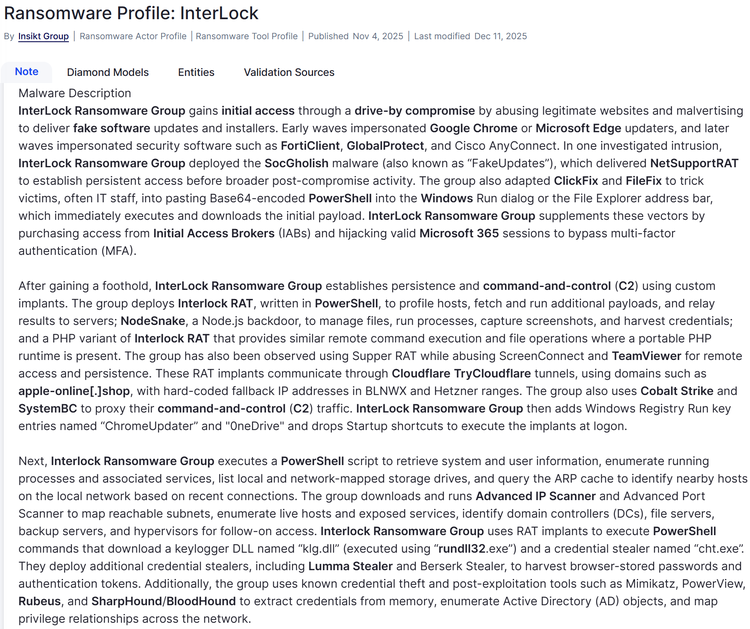
Interlock ransomware is a good example of an attack path. Interlock uses multiple tactics to acquire unauthorized access. One of their favorites is ClickFix-style social engineering: a fake CAPTCHA convinces a user to paste a command into the Windows Run dialog or PowerShell, which executes malware that harvests credentials, and the group moves laterally from there. That initial access is CVE-free at the point of entry, and it doesn’t appear on any vulnerability list. The entire path is identity and configuration edges. A defender with a perfect, fully patched vuln list has zero visibility into the path Interlock actually takes.
That’s one example of an attack path. Interlock employs numerous attack paths, and the group’s techniques and procedures constantly change to ensure continued success against defensive adaptations.
Now multiply those already numerous attack paths across ~800 ransomware groups. The permutations quickly cause a complexity issue for defenders. Lists and categories can’t keep pace with the offensive tempo, which is what exposure management has to solve.
The Solution
Effective CTEM means discovering and remediating attack paths before the adversary. The Breach and Attack Simulation (BAS) piece requires constant updates to traverse the graph and perform control validation. A snapshot of adversary behavior might be useful for a week, but tactics and procedures drift, so the snapshot decays quickly. Emulating adversary attack paths with clean fidelity and timeliness requires broad and timely intelligence collection.
MITRE ATT&CK codes, for example, may help analysts understand patterns, but automating attack path chains requires specific adversary procedures and details.
So What? Now What?
To avoid ransomware risk impacts, there are three timely questions for business executives.
- Are we scrutinizing the quality of CTEM solutions? How does a new edge type enter the graph, and how long does it take? If the answer is “quarterly content updates”, the graph is a museum and a beautiful record of what transpired during a breach.
- How are we investing in agentic R&D now to build trust and confidence in production deployments and ensure integrity with compliance obligations?
- When can we deploy continuous attack path recomputation, intelligence-weighted graph edge scoring, and agentic validation of new paths with choke-point remediation queues?
The scoreboard updates in real time, and the verdicts are public. The only open question is whether cyber defense recalibrates before the score changes again.